1. Introduction
From viral videos to bestselling books, we’re culturally conditioned to equate popularity with success. In business, that translates to an obsession with top-selling products—the ones that command prime shelf space, dominate marketing campaigns, and capture media buzz.
But here’s the uncomfortable truth: popularity does not guarantee profitability.
Across industries—from consumer goods to technology—companies are confronting a sobering realization: not everything that sells is worth selling. The new strategic imperative is not just to grow, but to grow profitably.
That shift demands a deeper question:
“Which products actually create sustainable value for the business?”
2.The Bestseller Illusion
Bestsellers attract attention and footfall. They suggest product-market fit and can generate short-term wins. But beneath the surface, they often conceal operational inefficiencies and thin margins.
Common pitfalls include:
Common pitfalls include:
- Low margins, due to aggressive pricing and competitive pressure
- High return rates, especially in fashion, electronics, or subjective purchases
- Promo dependency, where discounts artificially inflate demand
- Unsustainable CAC vs. CLTV, where acquisition costs outweigh customer lifetime value
In many cases, bestsellers are subsidized by your profitable products—not the other way around.
Brands often fall into the trap of pushing volume-heavy SKUs (Stock Keeping Unit) that:
Brands often fall into the trap of pushing volume-heavy SKUs (Stock Keeping Unit) that:
- Deliver poor gross margins
- Attract one-time, discount-driven customers
- Drag down average order value (AOV)
- Inflate customer service and logistics costs
- Cannibalize better-margin products in the same portfolio
This is a steep price to pay for mere visibility.
As Clayton Christensen warned through his theory of Disruptive Innovation, organizations often double down on what looks successful—only to discover it’s quietly eroding core value. The bestseller illusion functions the same way: shiny on the surface, fragile underneath.
As Clayton Christensen warned through his theory of Disruptive Innovation, organizations often double down on what looks successful—only to discover it’s quietly eroding core value. The bestseller illusion functions the same way: shiny on the surface, fragile underneath.
3.When Volume Hides Vulnerability
High sales volumes can lull businesses into a false sense of security. But big numbers often mask deeper structural inefficiencies:
- Discount Addiction: If a product only moves when marked down, it undermines both pricing power and brand equity
- Operational Burden: High-volume SKUs may strain warehousing, logistics, and fulfillment systems—often beyond efficient thresholds
- Cost Creep: Marginal costs for shipping, handling, returns, and customer care can quietly erode contribution
- Poor Customer Quality: Popular, low-margin products tend to attract deal-chasers, not loyal customers
Peter Drucker said it best:
“Profitability is not a function of sales, but of productivity.”
To get an honest picture, businesses must stop asking “What’s selling most?” and instead ask:
To get an honest picture, businesses must stop asking “What’s selling most?” and instead ask:
- Which products drive the highest contribution margin per unit?
- Which SKUs attract high-LTV customers?
- What’s the return rate per SKU, and how does that affect net profitability?
- Which products anchor larger baskets without undercutting better-margin items?
- What’s our true cost to serve for each product?
- The answers to these questions hold the key to business health—not sales dashboards.
4. Product-Level Profitability: A Strategic Lens
To escape the bestseller trap, businesses must shift from revenue obsession to contribution clarity. This means treating profitability not as a top-line metric, but as a product-level responsibility.
What that entails:
What that entails:
- Micro-P&L Thinking: Treat each product as an independent profit center
- Full-Cost Accounting: Factor in marketing, logistics, returns, and customer support—not just COGS
- Customer-Centric Profitability: Evaluate products based on the customer segments they attract and retain
- Dynamic Cost Allocation: Adopt Activity-Based Costing (ABC) to reflect true resource usage by SKU
These principles are echoed in Kaplan and Cooper’s Activity-Based Management framework, which encourages assigning real, granular costs to different activities and products.
5. Reframing Success Beyond Sales
Real commercial success isn’t about what sells fastest—it’s about what sustains your business long-term. That requires a broader, more strategic view of product performance.
What That Looks Like:
- Rethinking KPIs: Shift from gross sales to margin after marketing, profit per customer, and SKU-level ROI
- Smart Product Curation: Not every item needs to be a top seller. Some SKUs should be brand enhancers or margin anchors
- Focus on High-LTV Behaviors: Double down on products that drive repeat usage, referrals, and bigger baskets
- Inventory Efficiency: Optimize not just for stock turnover, but for profit-per-footprint—both in warehouses and on your website
Reframe Your Product Portfolio: Strategic > Popular
Organize your SKUs not by popularity, but by meaningful business impact.
Metric | Why It Matters |
|---|---|
Contribution Margin | Reflects real profitability after all costs |
Cross-Sell Potential | Boosts AOV through strategic bundling |
Repeat Purchase Rate | Indicates stickiness and customer loyalty |
Return Rate | Helps flag post-sale profit erosion |
Operational Complexity | High-touch SKUs may cost more to scale |
This strategic lens helps you decide what to scale, what to support, what to bundle, and what to retire.
6. Frameworks to Evaluate Product Profitability
To cut through the noise of raw sales numbers, businesses can adopt proven frameworks that prioritize profitability over volume:
a. Pareto Analysis (80/20 Rule)
Identify the 20% of products generating 80% of profits.
Double down on those. Trim the rest.
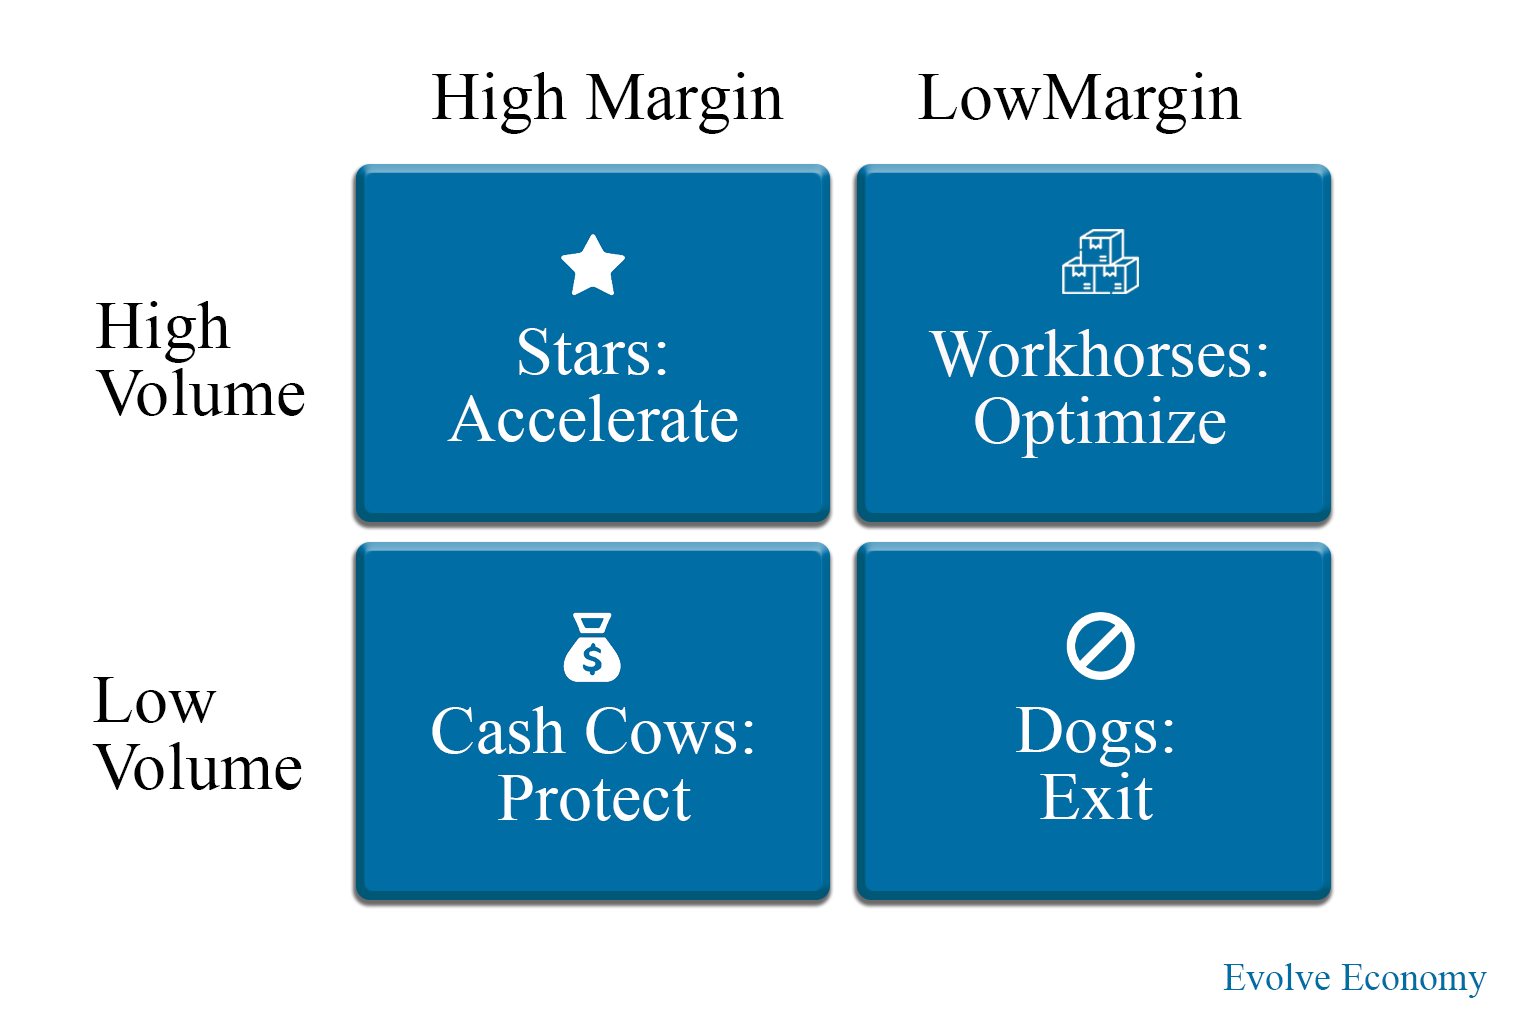
b. Contribution Margin Matrix
Plot your products along two axes—margin and volume:
Volume \ Margin | High Margin | Low Margin |
|---|---|---|
High Volume | Stars: Accelerate | Workhorses: Optimize |
Low Volume | Cash Cows: Protect | Dogs: Exit |
Inspired by the BCG Matrix, this model helps prioritize based on both scale and financial health.
c. Profitability Tree
Deconstruct profitability into granular components:
Pricing → CAC → Churn → Fulfillment Costs → Upsell Potential.
A sharp way to uncover hidden leakages.
d. Margin After Marketing (MAM)
Strip out media spends, influencer fees, and promos. Many “bestsellers” quickly fall from grace under this metric.
In margin-sensitive environment, sales volume is no longer a safe metric. The real question isn’t “What’s selling?”, but “What’s building the business?”
Smart companies don’t just celebrate top-line growth. They interrogate it. They move from chasing customers to cultivating contribution. From selling more to selling smarter.
The future belongs to businesses that look beyond the bestseller badge and focus on product-level profitability. Because in the long run, not everything that sells is gold.
The goal isn’t just to sell more. It’s to sell what sustains you.